Authors: Sascha Grunert
When speaking about observability in the cloud native space, then probably everyone will mention OpenTelemetry (OTEL) at some point in the conversation. That's great, because the community needs standards to rely on for developing all cluster components into the same direction. OpenTelemetry enables us to combine logs, metrics, traces and other contextual information (called baggage) into a single resource. Cluster administrators or software engineers can use this resource to get a viewport about what is going on in the cluster over a defined period of time. But how can Kubernetes itself make use of this technology stack?
Kubernetes consists of multiple components where some are independent and others are stacked together. Looking at the architecture from a container runtime perspective, then there are from the top to the bottom:
- kube-apiserver : Validates and configures data for the API objects
- kubelet : Agent running on each node
- CRI runtime : Container Runtime Interface (CRI) compatible container runtime like CRI-O or containerd
- OCI runtime : Lower level Open Container Initiative (OCI) runtime like runc or crun
- Linux kernel or Microsoft Windows : Underlying operating system
That means if we encounter a problem with running containers in Kubernetes, then we start looking at one of those components. Finding the root cause for problems is one of the most time consuming actions we face with the increased architectural complexity from today's cluster setups. Even if we know the component which seems to cause the issue, we still have to take the others into account to maintain a mental timeline of events which are going on. How do we achieve that? Well, most folks will probably stick to scraping logs, filtering them and assembling them together over the components borders. We also have metrics, right? Correct, but bringing metrics values in correlation with plain logs makes it even harder to track what is going on. Some metrics are also not made for debugging purposes. They have been defined based on the end user perspective of the cluster for linking usable alerts and not for developers debugging a cluster setup.
OpenTelemetry to the rescue: the project aims to combine signals such astraces, metrics and logs together to maintain the right viewport on the cluster state.
What is the current state of OpenTelemetry tracing in Kubernetes? From an API server perspective, we have alpha support for tracing since Kubernetes v1.22, which will graduate to beta in one of the upcoming releases. Unfortunately the beta graduation has missed the v1.26 Kubernetes release. The design proposal can be found in the API Server Tracing Kubernetes Enhancement Proposal (KEP) which provides more information about it.
The kubelet tracing part is tracked in another KEP, which was implemented in an alpha state in Kubernetes v1.25. A beta graduation is not planned as time of writing, but more may come in the v1.27 release cycle. There are other side-efforts going on beside both KEPs, for example klog is considering OTEL support, which would boost the observability by linking log messages to existing traces. Within SIG Instrumentation and SIG Node, we're also discussing how to link the kubelet traces together, because right now they're focused on thegRPC calls between the kubelet and the CRI container runtime.
CRI-O features OpenTelemetry tracing support since v1.23.0 and is working on continuously improving them, for example by attaching the logs to the traces or extending the spans to logical parts of the application. This helps users of the traces to gain the same information like parsing the logs, but with enhanced capabilities of scoping and filtering to other OTEL signals. The CRI-O maintainers are also working on a container monitoring replacement for conmon, which is calledconmon-rs and is purely written in Rust. One benefit of having a Rust implementation is to be able to add features like OpenTelemetry support, because the crates (libraries) for those already exist. This allows a tight integration with CRI-O and lets consumers see the most low level tracing data from their containers.
The containerd folks added tracing support since v1.6.0, which is available by using a plugin. Lower level OCI runtimes likerunc or crun feature no support for OTEL at all and it does not seem to exist a plan for that. We always have to consider that there is a performance overhead when collecting the traces as well as exporting them to a data sink. I still think it would be worth an evaluation on how extended telemetry collection could look like in OCI runtimes. Let's see if the Rust OCI runtime youki is considering something like that in the future.
I'll show you how to give it a try. For my demo I'll stick to a stack with a single local node that has runc, conmon-rs, CRI-O, and a kubelet. To enable tracing in the kubelet, I need to apply the following KubeletConfiguration:
apiVersion: kubelet.config.k8s.io/v1beta1
kind: KubeletConfiguration
featureGates:
 KubeletTracing: true
tracing:
 samplingRatePerMillion: 1000000
A samplingRatePerMillion equally to one million will internally translate to sampling everything. A similar configuration has to be applied to CRI-O; I can either start the crio binary with --enable-tracing and--tracing-sampling-rate-per-million 1000000 or we use a drop-in configuration like this:
cat /etc/crio/crio.conf.d/99-tracing.conf


[crio.tracing]
enable_tracing = true
tracing_sampling_rate_per_million = 1000000
To configure CRI-O to use conmon-rs, you require at least the latest CRI-O v1.25.x and conmon-rs v0.4.0. Then a configuration drop-in like this can be used to make CRI-O use conmon-rs:
cat /etc/crio/crio.conf.d/99-runtimes.conf


[crio.runtime]
default_runtime = "runc"

[crio.runtime.runtimes.runc]
runtime_type = "pod"
monitor_path = "/path/to/conmonrs" # or will be looked up in $PATH
That's it, the default configuration will point to an OpenTelemetry collector gRPC endpoint of localhost:4317, which has to be up and running as well. There are multiple ways to run OTLP as described in the docs, but it's also possible to kubectl proxy into an existing instance running within Kubernetes.
If everything is set up, then the collector should log that there are incoming traces:
ScopeSpans #0
ScopeSpans SchemaURL:
InstrumentationScope go.opentelemetry.io/otel/sdk/tracer
Span #0
Trace ID : 71896e69f7d337730dfedb6356e74f01
Parent ID : a2a7714534c017e6
ID : 1d27dbaf38b9da8b
Name : github.com/cri-o/cri-o/server.(*Server).filterSandboxList
Kind : SPAN_KIND_INTERNAL
Start time : 2022-11-15 09:50:20.060325562 +0000 UTC
End time : 2022-11-15 09:50:20.060326291 +0000 UTC
Status code : STATUS_CODE_UNSET
Status message :
Span #1
Trace ID : 71896e69f7d337730dfedb6356e74f01
Parent ID : a837a005d4389579
ID : a2a7714534c017e6
Name : github.com/cri-o/cri-o/server.(*Server).ListPodSandbox
Kind : SPAN_KIND_INTERNAL
Start time : 2022-11-15 09:50:20.060321973 +0000 UTC
End time : 2022-11-15 09:50:20.060330602 +0000 UTC
Status code : STATUS_CODE_UNSET
Status message :
Span #2
Trace ID : fae6742709d51a9b6606b6cb9f381b96
Parent ID : 3755d12b32610516
ID : 0492afd26519b4b0
Name : github.com/cri-o/cri-o/server.(*Server).filterContainerList
Kind : SPAN_KIND_INTERNAL
Start time : 2022-11-15 09:50:20.0607746 +0000 UTC
End time : 2022-11-15 09:50:20.060795505 +0000 UTC
Status code : STATUS_CODE_UNSET
Status message :
Events:
SpanEvent #0
-> Name: log
-> Timestamp: 2022-11-15 09:50:20.060778668 +0000 UTC
-> DroppedAttributesCount: 0
-> Attributes::
-> id: Str(adf791e5-2eb8-4425-b092-f217923fef93)
-> log.message: Str(No filters were applied, returning full container list)
-> log.severity: Str(DEBUG)
-> name: Str(/runtime.v1.RuntimeService/ListContainers)
I can see that the spans have a trace ID and typically have a parent attached. Events such as logs are part of the output as well. In the above case, the kubelet is periodically triggering a ListPodSandbox RPC to CRI-O caused by the Pod Lifecycle Event Generator (PLEG). Displaying those traces can be done via, for example, Jaeger. When running the tracing stack locally, then a Jaeger instance should be exposed on http://localhost:16686 per default.
The ListPodSandbox requests are directly visible within the Jaeger UI:
That's not too exciting, so I'll run a workload directly via kubectl:
kubectl run -it --rm --restart=Never --image=alpine alpine -- echo hi


hi
pod "alpine" deleted
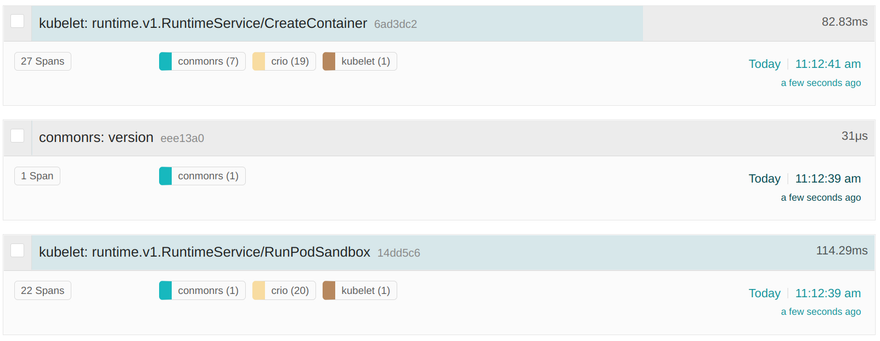
Looking now at Jaeger, we can see that we have traces for conmonrs, crio as well as the kubelet for the RunPodSandbox and CreateContainer CRI RPCs:
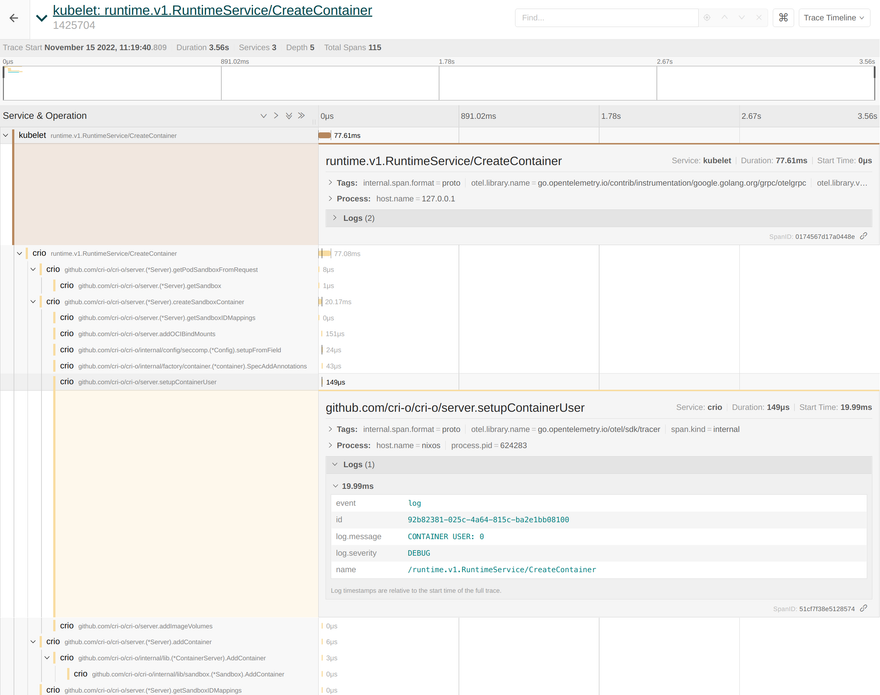
The kubelet and CRI-O spans are connected to each other to make investigation easier. If we now take a closer look at the spans, then we can see that CRI-O's logs are correctly accosted with the corresponding functionality. For example we can extract the container user from the traces like this:
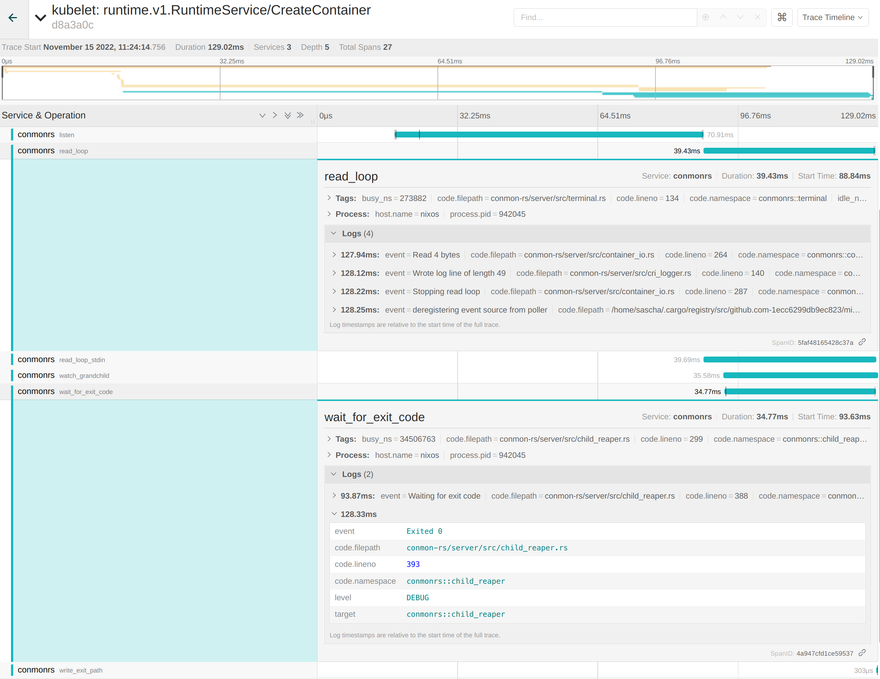
The lower level spans of conmon-rs are also part of this trace. For example conmon-rs maintains an internal read_loop for handling IO between the container and the end user. The logs for reading and writing bytes are part of the span. The same applies to the wait_for_exit_code span, which tells us that the container exited successfully with code 0:
Having all that information at hand side by side to the filtering capabilities of Jaeger makes the whole stack a great solution for debugging container issues! Mentioning the "whole stack" also shows the biggest downside of the overall approach: Compared to parsing logs it adds a noticeable overhead on top of the cluster setup. Users have to maintain a sink like Elasticsearch to persist the data, expose the Jaeger UI and possibly take the performance drawback into account. Anyways, it's still one of the best ways to increase the observability aspect of Kubernetes.
Thank you for reading this blog post, I'm pretty sure we're looking into a bright future for OpenTelemetry support in Kubernetes to make troubleshooting simpler.


Top comments (0)